by JAMES GUTHRIE
The annual reports of the four public universities in WA are now available, as is the Auditor General of Western Australia’s report on them and TAFE for 2021 (i)
Last year I analysed how these universities highlight financial results regarding the reconciliation from operating results to underlying results. This raised some questions because it is not a formal accounting statement but rather some internally generated statement that includes one-off or restricted items. For instance, the recognition of income from investments is unclear if the expenditure on the original investments shows as an operating expense. (ii).
This year I will concentrate the analysis on financial assets and the accounting treatment of the Education Australia Limited sell-off. I will also undertake a brief case study of UWA. This particular university is interesting because its financial accounting is more like BHP than that of a publicly funded organisation. This case study argues that public sector universities should be managed and reported on a funds basis of accounting.
First, turning to the State of the finances of the WA public universities, others have commented on using the accrual financial reports to draw various conclusions about changes in revenue, expenses, net operating results and increases in net asset positions on a year-by-year basis. One might ask why it is important to compare one year with another ‒ instead, we should judge these public universities’ overall financial strength and performance against other key performance indicators. The WA Government requires key performance indicators to be disclosed; these are key effectiveness and key efficiency indicators, which tell us much more about how a university is fulfilling its purpose and discharging its duty as per legislation rather than its revenue and expenses.
Of interest are the liquid financial assets the university holds in current and non-current forms. The following table indicates the considerable wealth of UWA and how much it has grown over the last four years. UWA had nearly $1.3bn in liquid assets as of December 31 2021, which has grown by nearly $400m since 2017. These are investments, surplus funds from teaching and research and immaterial donations from benefactors.
| From teaching and research Current and non-current cash and other financial assets ($ million) | 2017 | 2018 | 2019 | 2020 | 2021 |
| Curtin | 567 | 630 | 688 | 638 | 740 |
| ECU | 328 | 371 | 495 | 502 | 902 |
| Murdoch | 171 | 208 | 196 | 209 | 222 |
| UWA | 889 | 871 | 922 | 1,055 | 1,280 |
Source: OAG calculated from audited annual financial statements
Second, regarding Education Australia Limited (EAL) accounting treatment and investments in IDP Education Ltd, several commentators have suggested this materially increased university surpluses in 2021. EAL was a company to promote the Australian university sector. Each of the 38 Australian universities, including the four WA state public universities, held 10 000 shares at $1 each in EAL. In March 2021, EAL announced a restructure before its winding up, which is expected to occur in 2022. As part of the restructure, EAL would divest its 40 per cent shareholding in IDP Education Ltd (IDP), an international student placement provider that owns the International English Language Testing System (IELTS).
If we issue each university a cash dividend of $30 million, this would not be material regarding the total revenues for that university. However, the universities in Australia used at least two methods to account for this. Here, the critical issue is whether the distributions to universities should be treated as income (dividend revenue) or the initial investment cost recovery. The universities in WA were mixed in their accounting approach, with Curtin U treating it as book revenue of $30.3 million, whilst others used the other accounting treatment without any impact on the statement of comprehensive income.
Figure 1 highlights the impact of this financial move on the original owners (source, WA OAG, 2022
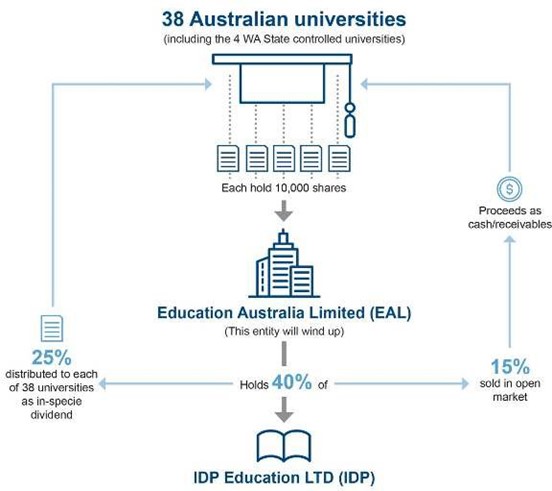
Marketisation (turning pubic assets into tradable stock market shares) lies at the heart of the public universities’ corporatised EAL. The primary winners of this financial exercise appear to be the consulting companies, lawyers and stock exchange owners. The biggest winner was the CEO of EAL, who received a massive payout of $30 million for one year’s work, the most significant CEO payment in Australia at the time. (iii)
Third, a case analysis of UWA reveals that it operates like a multinational mining company in terms of its perspective on financial management. UWA’s annual report states, “the 2021 financial year represents a strong start to the university’s financial sustainable journey, as the university seeks to create financial capacity to invest in our future with a focus on enhancing student experience and transforming our digital and physical environments.”
The university is planning to receive a rate of return on underlying operations, which it estimates from now to 2025 as being a 15 per cent EBITDA margin; these underlying operations are to generate a 15 per cent rate of return in terms of surplus before interest, tax and depreciation (e.g. Engineering School to return 15 per cent per year on income earned and expenditures spent). This is where the numbers get interesting, as the university argues that without efficiency gains and cost-cutting, it would not be able to undertake its annual operating activities without generating a significant deficit. This is one of the few public universities’ financial accounts and narratives that states it requires such a rate of return in its ring-fenced operations, known as an “underlying result.”
The following income statement highlights that most revenues come from government grants and student fees. Also, considerable money from other revenue and income is investment-related and not used in “underlying results”. On the expense side, we have several accruals, such as depreciation and impairments, and the most considerable number other than employee-related expenses is other expenses ‒ we have no idea what these expenses are.
INCOME STATEMENT
for the year ended 31 December 2020
| Consolidated
2021 |
restated 2020 |
University
2021 |
restated 2020 |
||
| Notes | $’000 | $’000 | $’000 | $’000 | |
|
Revenue and income from continuing operations |
|||||
| Australian Government financial assistance | |||||
| Australian Government grants | 2.1 | 435,939 | 375,838 | 430,732 | 366,203 |
| HELP – Australian Government payments | 2.1 | 128,950 | 121,021 | 128,950 | 121,021 |
| Western Australian and Local Government financial assistance | 2.2 | 52,229 | 46,388 | 42,795 | 40,975 |
| HECS-HELP – student payments | 13,343 | 13,329 | 13,343 | 13,329 | |
| Fees and charges | 2.3 | 175,339 | 176,181 | 173,756 | 174,945 |
| Investment revenue and income | 2.4 | 153,157 | 58,571 | 153,154 | 58,556 |
| Royalties, trademarks and licences | 10,733 | 7,328 | 10,733 | 7,328 | |
| Consultancy and other contracts | 2.5 | 74,614 | 80,173 | 74,614 | 80,173 |
| Gains on disposal of assets | 3,581 | 92 | 3,563 | 96 | |
| Other revenue and income | 2.6 | 128,427 | 110,641 | 116,190 | 102,484 |
| Total revenue and income from continuing operations | 1,176,312 | 989,562 | 1,147,830 | 965,110 | |
|
Expenses from continuing operations |
|||||
| Employee related expenses | 3.1 | 558,604 | 553,345 | 542,782 | 539,140 |
| Depreciation and amortisation | 4.1 | 54,003 | 53,442 | 53,597 | 53,086 |
| Repairs and maintenance | 4.1 | 22,731 | 20,704 | 22,286 | 20,506 |
| Borrowing costs | 4.1 | 5,827 | 6,285 | 5,822 | 6,279 |
| Impairment of assets | 4.1 | 292 | 3,480 | 292 | 3,480 |
| Student expenses | 4.1 | 43,591 | 42,062 | 45,004 | 42,723 |
| Materials and supplies | 4.1 | 30,825 | 26,131 | 27,749 | 24,100 |
| Grants distributed | 4.1 | 100,350 | 86,525 | 100,888 | 86,823 |
| Travel | 4.1 | 4,159 | 4,158 | 4,106 | 4,124 |
| Professional fees | 4.1 | 32,017 | 32,330 | 31,741 | 32,040 |
| Other expenses | 4.1 | 120,396 | 114,503 | 111,015 | 103,230 |
| Total expenses from continuing operations | 972,795 | 942,965 | 945,282 | 915,531 | |
| Net result attributable to members from continuing operations | 203,517 | 46,597 | 202,548 | 49,579 | |
|
Net result from continuing operation |
203,517 |
46,597 |
202,548 |
49,579 |
|
| Net result attributable to members | 203,517 | 46,597 | 202,548 | 49,579 |
From these points above, we see a conflict in the way universities tell their financial story. The Federal Government pays in cash, the local students pay cash through the HECS‒HELP programme, and the international on-shore students pay in cash. UWA prepares internal budgets on a cash (fund) basis over time. However, the law requires it to report publicly on its financial position on an accrual basis in audited financial statements and cash flow statements. Hence, the conflict between cash versus accrual accounting. The basis of this conflict is ideological, in which our universities are corporatised, and their public interest purpose is undermined.
In a submission to the Legislative Council Select Committee ‒ Inquiry into the Provisions of the University of Tasmania Act 1992, (iv) I called for an entirely different discourse for university performance in Australia; this includes all public universities in WA. The discourse is not based on financial accrual costs in the context of orthodox business commercial accounting arising from the neoliberal corporatisation of Australian public universities over decades. In doing so, I am consistent with others, such as Andrew and Cahill (2017), who highlight that alternative discourses must be developed to understand the public value of universities (v)
For instance, UWA is a not-for-profit organisation as a registered charity. It states its mission as, “to advance the welfare and prosperity of the people through educational and research activities “‒ a statement first defined with the foundation of the university by the University of Western Australia Act 1911. The mission is to provide “world-class education, research and community engagement for the advancement of the prosperity and welfare of our communities”.
This is how we should judge the performance of vice chancellor and council, not in terms of a rate of return or efficiency gains and cost-cutting, but in terms of maintaining the public value of this public university.
Emeritus Professor James Guthrie AM, Professor of Accounting, Macquarie Business School
(i) Auditor General of Western Australia’s report (OWA AG) The State’s universities and TAFE for 2021.
(ii) James Guthrie (2021), What the UWA annual report reveals, Campus Morning Mail, 19 July 2021 https://campusmorningmail.com.au/news/what-the-uwa-annual-report-reveals/
(iii) He’s a CEO many of you have never heard of, but IDP Education’s Andrew Barkla was the nation’s highest-paid chief executive in the 2019 financial year, taking away $38 million — that’s about 420 times the average wage. https://www.abc.net.au/news/2020-08-07/idp-education-ceo-andrew-barkla-tops-acsi-list-of-highest-paid/12531862
[iv] Guthrie, J. (2022), Submission to the Legislative Council Select Committee ‒ Inquiry into the Provisions of the University of Tasmania Act 1992, 25 May 2022. July; Guthrie, J. (2022), Second Submission to the Legislative Council Select Committee ‒ Inquiry into the Provisions of the University of Tasmania Act 1992, August 2022.
(v) Andrew, J. and Cahill, D. (2017), “Rationalising and resisting neoliberalism: The uneven geography of costs”, Critical Perspectives on Accounting, Vol. 45, pp. 12-28 https://doi.org/10.1016/j.cpa.2016.09.0011